Hi Why Your Data Visualization Should Be Like Lady Gaga’s Eyeliner.
Inspiration can come from the most unexpected places. Who said something as simple as eyeliner – even if it is Lady Gaga’s – would stir the average market researcher?
.png)
First used in Ancient Egypt, eyeliner has long been used to draw attention to the eye and to accentuate its features.
As market researchers, this should be fairly familiar ground to us. We, too, are in the business of doing just that – drawing attention to marketing data that should be highlighted, because it has significance.
But are we doing everything we can, to make our mark – whether with black kohl liner or not?
"Eyes are the windows soul"
… or so the saying goes.
Recent research maintains there could be more to this theory than meets the eye (pun intended). If iris patterns really are linked to personality traits, perhaps we should be paying greater attention to others’ peepers.
This highlights another of the market researcher’s dilemmas…
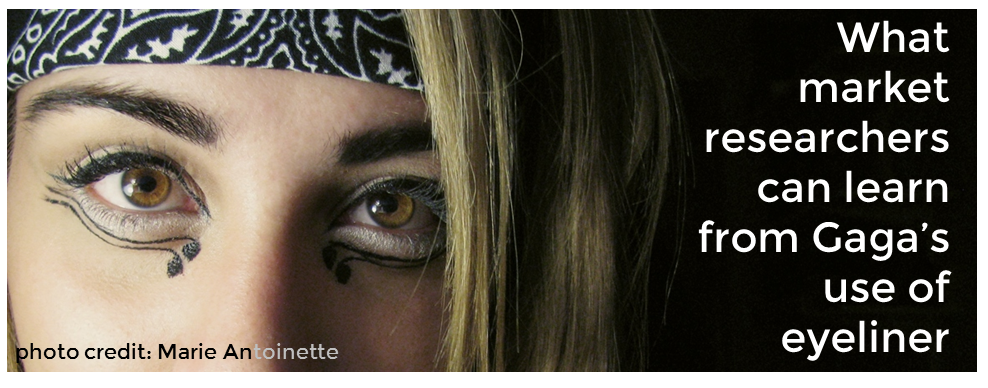
If you take a good look at Lady Gaga, her famous eyeliner is so dramatic and over the top, it draws you in and commands you to take notice… of her lyrics, of her style, of her attitude and yes, of her eyes.
The question is, if we’re as proficient at highlighting data as we should be, is it the right data that we’re drawing attention to?
Clever data visualization isn’t just born that way!
Data visualization allows you to make sense of complex data quickly and potentially overlay data from multiple sources, for a more holistic picture.
Once you have the right data at your fingertips, you can distil it to your audience.
Just as eyeliner accentuates the eyes, clever data visualization does the storytelling. It draws you in and commands you to take notice … of the differences, of the trends, and of patterns in general.
End the bad romance with your market research data:
Also of significant importance is the fact that data visualization allows wide-spread sharing of information within an organization.
Gone are the days of researchers thumbing through reams of cross-tabs and carefully guarding data. Clear, concise visual depiction of data can be understood by all levels and functions within an organization.
This sharing of information is important, because ultimately the value of data depends on the decisions that come from it, collectively.
As market researchers, how can we apply this learning to what we do?
Symbolically, eyes represent vision, prophecy, observation, perception and awareness. These are all traits that make a good market researcher.
If you’re in the business of using marketing data, you’ll understand how important visuals are. While data isn’t necessarily a crystal ball, being able to see, interact and even manipulate your marketing data visually can be very powerful in generating meaningful insights.
So the next time you see Lady Gaga’s trademark brows, take notice of how they draw you in and make you pay attention.
Ultimately, isn’t that what good data visualization should do?


